
2026-04-12
如何透過圖表分析客群(新舊客戶比例、營業額走勢、分類銷售)?
功能位置:左側導覽列「商家分析」
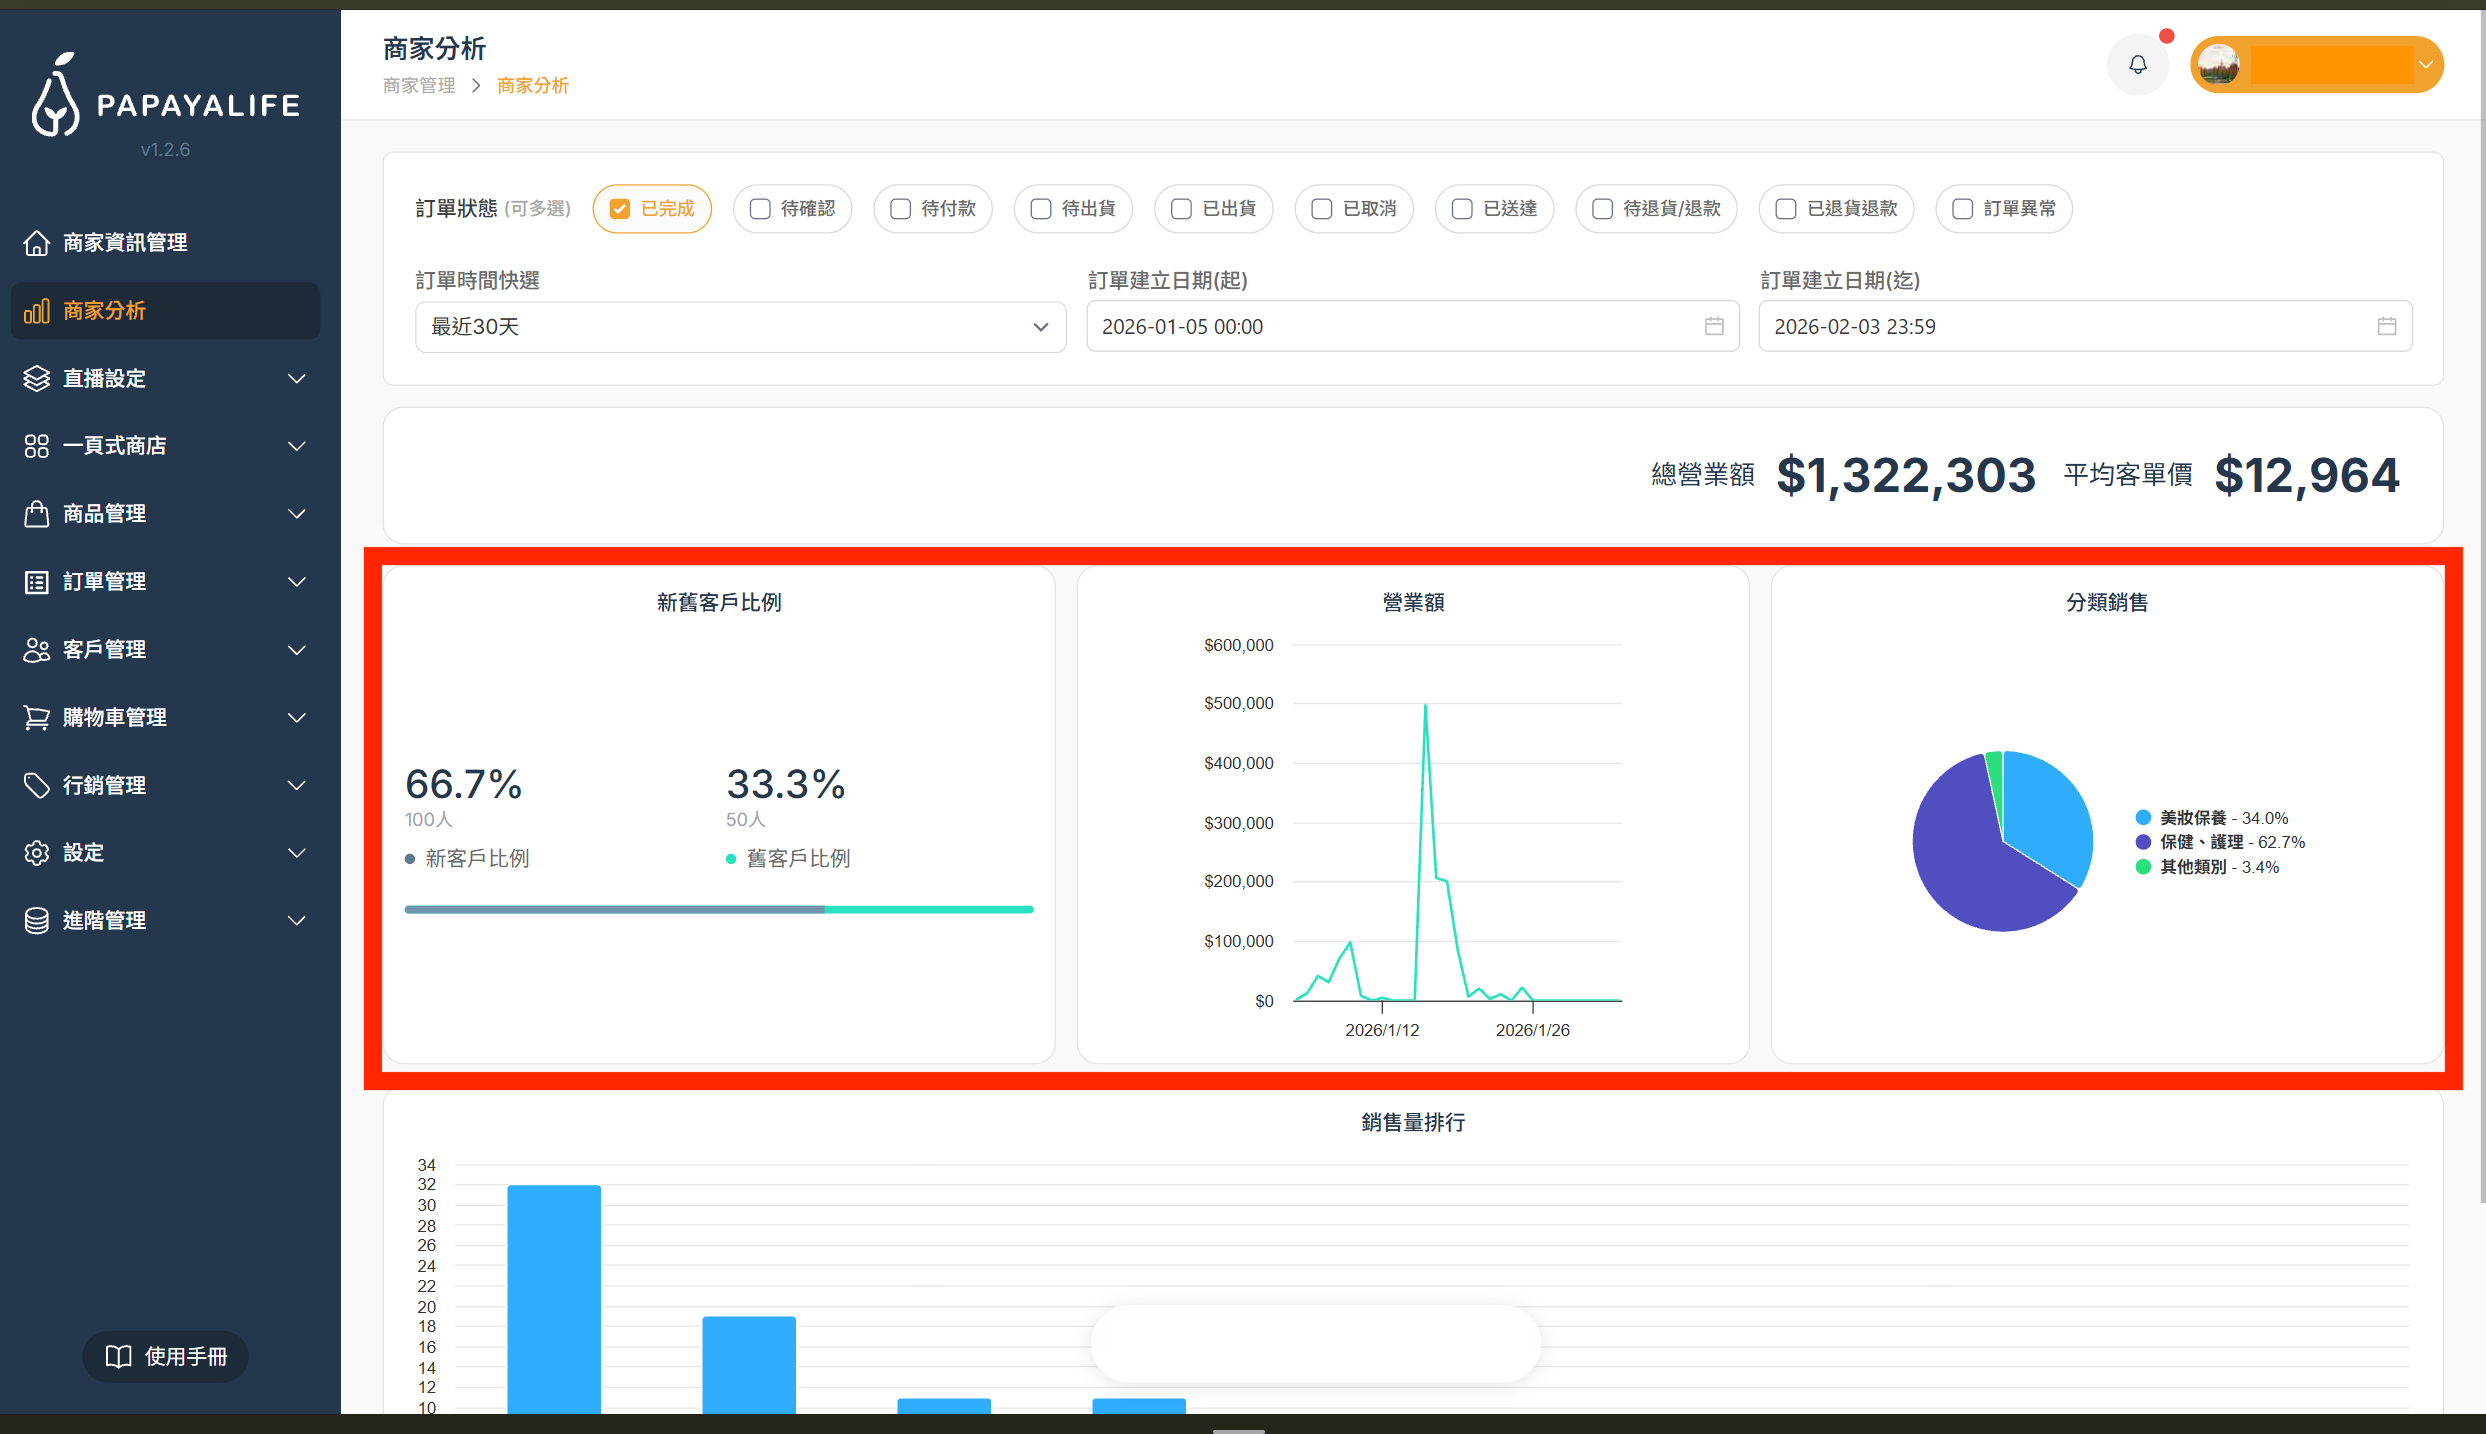
新舊客戶比例
顯示區間內新客與舊客的人數佔比。
新客佔比高代表引流或廣告效果顯著;舊客佔比高代表顧客忠誠度與回購意願強,若新客比例過低,建議可以舉辦「分享直播抽獎」擴大觸及。
營業額走勢:
顯示業績起伏變化。圖表上的波峰(高點)通常對應「直播日」、「發薪日」或「促銷活動日」。
可觀察波峰規律(如每週五晚上業績特別好),以此固定開播時段。
分類銷售
顯示不同商品分類(如:上衣、褲子、飾品)的銷售金額佔比,協助一眼識別店鋪的「主力營收品類」,作為下次進貨優先備足庫存的參考。